Business Intelligence
Business Intelligence – Business Accounting Software
Not all business processes can be measured in pure financial terms. Some important business drivers which have measurable impacts on key business objectives and overall business performance, cannot be measured in $s or €s.
Likewise some business drivers which can be measured in $s, need to be related to other measures to make them more meaningful (e.g. Increasing Support costs per call serviced tell a different story than reducing Total Support costs).
Measures such as these are often called Key Performance Indicators (KPIs) and give management real Business Intelligence “BI” that helps them make better informed decisions on how to improve performance.
BI Approach
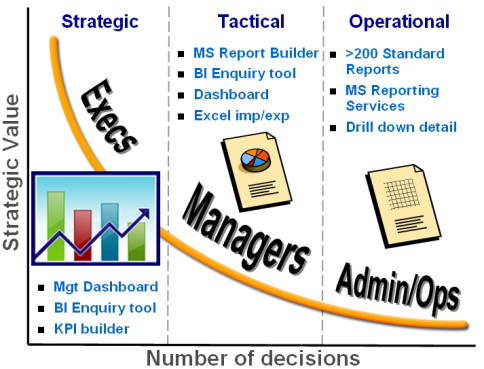
To compete effectively, a business needs an edge to keep it sharp and focussed.
The application gives this edge through its BI features. In addition to a full suite of accounting and commercial modules. It incorporates an extensive business analytics capability including:
All transactions are coded to a GL code but in addition can be analysed to up to 6 levels of user-defined analysis – by business line, location, cost center, department, project, job, profit center or whatever way is important to your business.
The analysis codes and analysis groups can be labelled specifically to your naming conventions
This analysis can be added at any stage by simply flagging the GL accounts that need further analysis. For GL codes not flagged the user is not asked for an analysis code
Budgets can be maintained at the same level of analysis
The financial data can then be combined with user defined statistics that are analysed in the same way to produce Key Performance Indicators (KPIs)
Key Performance Indicators
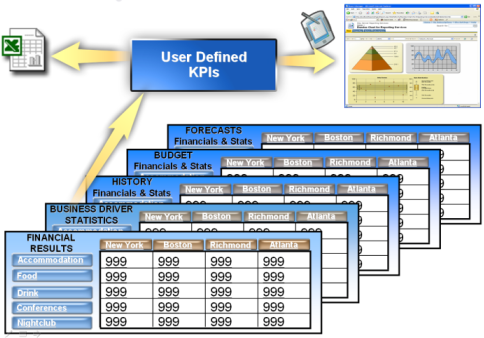
KPIs are any combination of these financial results and statistical measures.
All financial results, statistics and KPIs can be extracted in reports or dashboard graphs or tables.
They can be benchmarked against budget, revised budget/forecast or historic results.
This enables DynamicsIQ to be a full repository for all Business Intelligence including:
- KPIs based on Statistics, financials or both
- SLA performance measures
- Customer satisfaction measures
- Scorecards
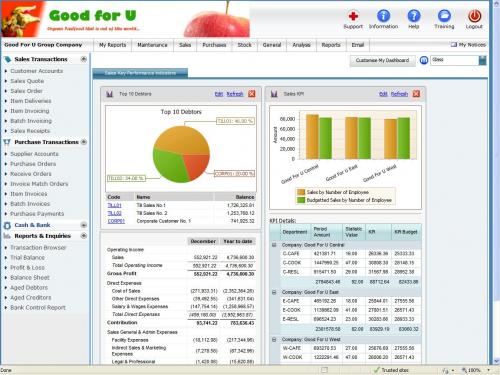
All this can be accessible in realtime on a user definable Dashboard or extracted to Excel for further analysis.
For groups and multiple entity businesses such as franchises, consolidated results for the group or benchmark KPIs across the group can be shown on a dashboard like this:
FOLLOW US